
….And stickers too!!
Common MASH Queries
….And stickers too!!

We would like to welcome Phil Assheton to the Library team and more specifically welcome him to MASH. Phil is our Maths specialist in MASH with a background in computing, maths and finance. He’s gone part time in his other job, in financial modelling, to provide support at the centre on Thursdays and Fridays. Many of you may recognise Phil as he’s been expertly volunteering with us for some time now.
Contact Phil directly Passheton@lincoln.ac.uk or via our general email MASH@lincoln.ac.uk.
Having Phil on board has enabled us to offer more drop-in hours. MASH drop-in can be found in the Learning Development room on the ground floor of the Library.
Our hours are now:

Tuesday: 10-1
Friday: 1- 4
Once again, this is something i’ve been asked a fair about recently…’How is Cronbach’s Alpha found using SPSS’
There is a good walk-though on page 196 of Hugh Coolicans book, Research Methods and Statistics in Psychology (5th Ed.). This book explains the use of this reliability test, it’s limitations and offers a guide to interpreting your output.
Here is a screen-by-screen walkthrough of the process:
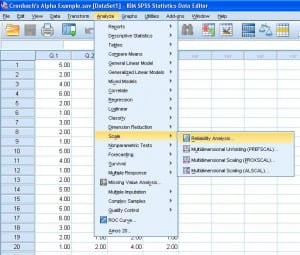
Choose Analyse
→ Scale
→ Reliability Analysis
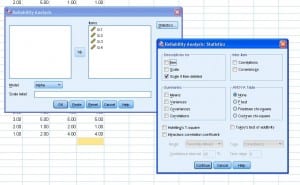
Move the variables you’d like to be considered from the left box to the items box on the left. Make sure the model Alpha is selected (it tends to be as default). Select Options and choose what you would like to see in the output. I opted for Scale if item deleted, this is a preference of mine, but not necessarily what you’ll always want. I suggest to look in the Coolican (2009) book for assistance with your choice at this point.
Once you click Continue and then OK, SPSS will produce an output similar to this:
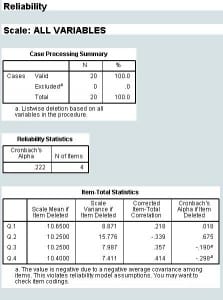
The second table, the Reliability Statistics, gives you the Cronbach’s Alpha value.
Refer to Coolican (2009) or other statistics book (plenty available in the library) for further help on interpreting the results.
Reverse scoring is something that I’ve been asked about a good few times. This useful when you have collected data on a questionnaire with Likert scale answers (i.e. 1 to 5, 1 to 7, 1 to 10 etc.). Often you find that some questions in the set refer to a score of 1 being low and other questions 1 is a high score. What you would need to do is reverse ONE set of questions, either the 1 = low set, or the 1=high set, so that all the questions are consistent.
I tend to suggested to students to work on the data in Excel before you transfer it into SPSS. I suggest this as students are often much more comfortable Excel than SPSS. However, there is a way to do it in SPSS and here is a really good, clear video showing exactly how to do it:
I’ve had a few people into the centre recently trying to get their heads around degrees of freedom. Even if it’s not necessarily something that you need to know, it is often handy to have an understand of it, to help get a holistic upstanding of statistical testing.
Ron Dotsch does a great job of explaining Degrees of Freedom. Ron is a Experimental Social Psychologist. He is an Assistant Professor at Radboud University Nijmegen in the Netherlands. Ron has very nicely written a post about degrees of freedom. It is a nice concise overview and although I tend to favour videos to post up here, I haven’t found (and I think i’d be pushed to do so) anything better than this.
I highly recommend the read…
Survival analysis is something i’ve been asked about a few times now. I’m yet to find a really great resource, however, if you’re keen here’s a fairly clear lecture about it. Enjoy!
To those who don’t know of him, I’d like to quickly introduce you to Hans Rosling, Professor of Global Health. Hans has a mission to show that statistics can be fun. Although I’m already sold on this concept, I am well aware that the majority are not!
As part of his mission he has co-founded and is chairman of the Gapminder Foundation. The Gapminder Foundation has set out its aims to:
“…promote sustainable global development and achievement of the United Nations Millennium Development Goals by increased use and understanding of statistics and other information about social, economic and environmental development at local, national and global levels.”
The video below is a snippet of his work and introduction to Trendalyzer; software developed by the Gapfinder Foundation that converts international statistics into interactive graphs.
Follow Hans on Twitter